What is Horizontal Pod Autoscaling?
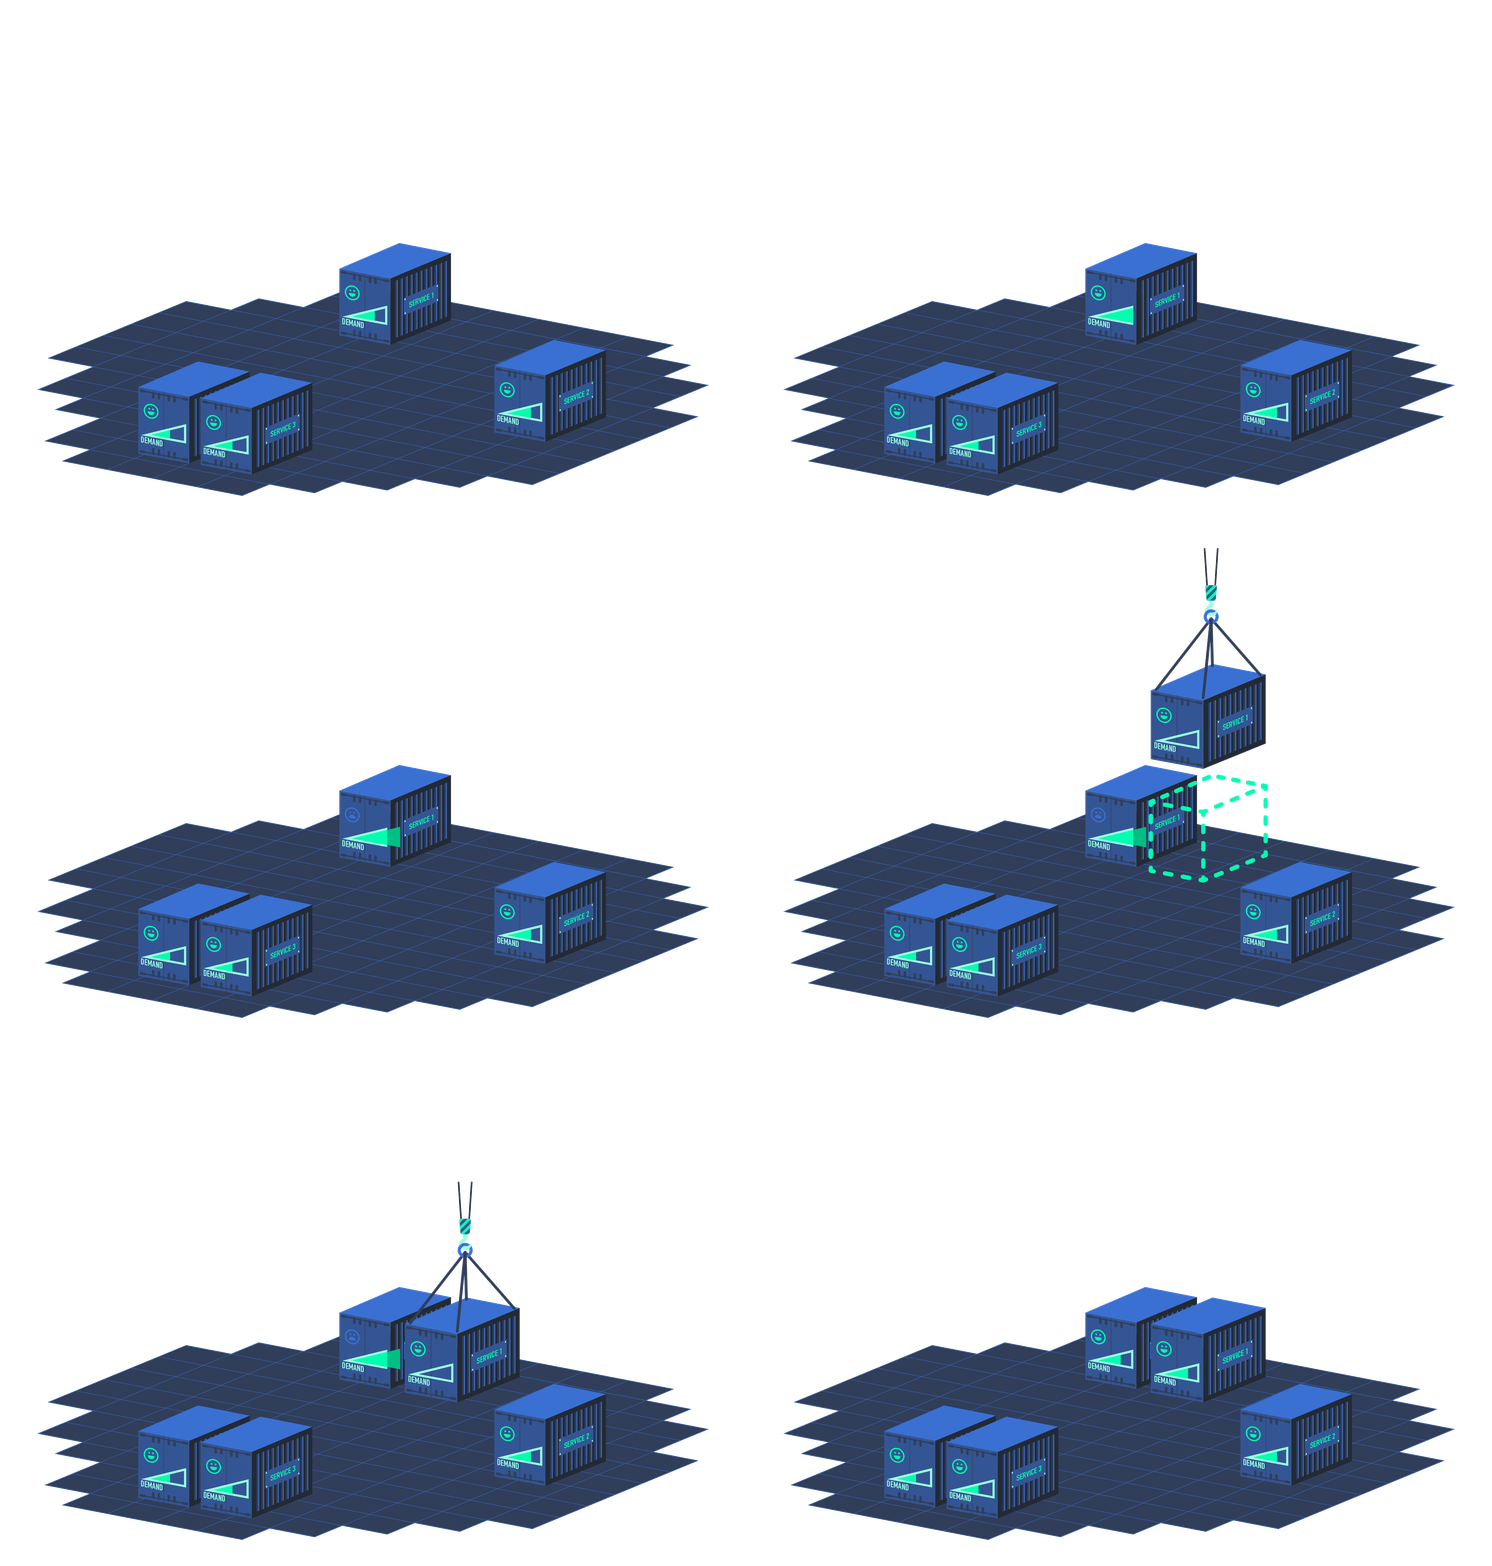
By default, Kubernetes can perform horizontal autoscaling of pods based on observed CPU utilisation (average CPU load across all the pods in a deployment). The HPA works as a control loop like every other controller in the Kubernetes cluster - each time it starts up, it gets the metrics for the pods for the period since the last loop and queries this resource utilisation against the baselines specified in the HPA.
Based on the difference between the observed metrics and the average usage baseline, the HPA will either reduce or increase the number of pods in the set to a level that will enable each pod in the set to match the desired baseline usage as closely as possible. The baseline is calculated based on the CPU limit in the pod specifications, for example:
resources:
  requests:
    cpu: 25m
  limits:
    cpu: 100m
This means if we have a baseline CPU target of 50%, and we have pods which each have a 100m limit, we will aim for under 50m usage per pod. Say we have a set of five pods that have a combined distributed load of 240m (so 48m cpu per pod), with 48% average cpu utilisation. If we suddenly receive a spike in requests that causes the load to shoot up to a combined distributed load of 350m, this will cause pod utilisation to shoot up to 70m (or 70%). In order to bring utilisation back to 50%, this will require the HPA to spawn two new pods for the average load to fall back down to 50m per pod.

But for most real-life use cases, it doesn’t make sense to scale based on CPU usage - for applications which service requests from users, the traffic load is a much more applicable metric. You may even wish to determine load based on an algorithm that incorporates a number of different metrics. This is where we start to jump into the deep end.
In this blog post, we’ll take a look at how we can perform autoscaling based on metrics collected by Prometheus.
Custom and External Metrics APIs
There are three metrics APIs the HPA uses:
Resource metrics are outputted @
metrics.k8s.io. This is the use case for our example above. The metrics.k8s.io api relies on metrics to be forwarded to it by a metrics aggregator. This will be metrics-server, or can also be heapster (although support is now deprecated)Custom metrics are outputted @
custom.metrics.k8s.io. You’ll use this if you want to scale based on metrics based in Kubernetes objects like pods or nodes, or metrics that are output by your workload using a /metrics endpoint. Getting these metrics into custom.metrics.k8s.io relies on an additional metrics adapter.External metrics are outputted @
external.metrics.k8s.io. You’ll use this if you would like to scale based on metrics in your existing metrics aggregator (like stackdriver or Prometheus). This API is implemented in the same way as custom.metrics.k8s.io

In order to set up these two additional metrics APIs, this requires the API aggregation layer to be supported by the Kubernetes API. And this flag must be enabled (it is now the default):
--horizontal-pod-autoscaler-use-rest-clients
The custom and external metrics API is not available by default, so we need to set up these new API servers on the Kubernetes control plane. Kubernetes allows us to do this using APIService objects. Even metrics-server has its own APIService object:
NAME                       SERVICE                       AVAILABLE   AGE
v1beta1.metrics.k8s.io     kube-system/metrics-server    True        24h
If we take a look at it, we can see what the function of an APIService is:
apiVersion: apiregistration.k8s.io/v1
kind: APIService
metadata:
  labels:
    addonmanager.kubernetes.io/mode: Reconcile
    kubernetes.io/minikube-addons: metrics-server
  name: v1beta1.metrics.k8s.io
spec:
  group: metrics.k8s.io
  groupPriorityMinimum: 100
  insecureSkipTLSVerify: true
  service:
    name: metrics-server
    namespace: kube-system
  version: v1beta1
  versionPriority: 100
We can see that all requests to v1beta1.metrics.k8s.io are routed to the service that distributes these requests to the metrics-server pods, which acts as the metrics adapter for this API. We also define the API grouping this should use as metrics.k8s.io.
This means we need a metrics adapter that we can tell the APIService for external.metrics.k8s.io to forward requests to.
A good one to use is kube-metrics-adapter, which most notably implements pod collectors for custom.metrics.k8s.io and Prometheus collectors for external.metrics.k8s.io.
These Prometheus collectors enable us to configure a HPA to fetch metrics from Prometheus using queries written using PromQL and perform autoscaling based on the results of that query. We define Prometheus collectors using annotations in the hpa object, and then provide the name of the Prometheus collector as the desired metric in the HPA specification.
Kube-metrics-adapter includes a control loop that watches the HPA objects on the cluster and creates and deletes Prometheus collectors based on these definitions. This means that, rather than forwarding a complete set of metrics to the metrics api, only the results of the _PromQL queries we’ve configured are streamed.
An example of a HPA object that defines and uses a Prometheus collector:
apiVersion: autoscaling/v2beta1
kind: HorizontalPodAutoscaler
metadata:
 name: hpa-test
 namespace: dev
 annotations:
   # metric-config.<metricType>.<metricName>.<collectorName>/<configKey>
   # <configKey> == query-name
   metric-config.external.prometheus-query.prometheus/autoregister_queue_latency: autoregister_queue_latency{endpoint="https",job="apiserver",namespace="default",quantile="0.99",service="kubernetes"}
spec:
 scaleTargetRef:
   apiVersion: extensions/v1beta1
   kind: Deployment
   name: test
 minReplicas: 1
 maxReplicas: 10
 metrics:
 - type: External
   external:
     metricName: prometheus-query
     metricSelector:
       matchLabels:
         query-name: autoregister_queue_latency
     targetAverageValue: 1
Although you will see external metrics in the autoscale/v2beta1 specification in the Kubernetes docs, note that external metrics are only supported in versions of Kube which support the autoscale/v2beta2 specification (so anything after 1.10.0). External metrics aren’t in autoscale/v2beta1 in 1.9, but are in subsequent versions.
This also means there is a difference between the two specifications when we create HPA Kubernetes objects using autoscaling/v2beta2.
Example: the previous HPA using the new specification:
apiVersion: autoscaling/v2beta2
kind: HorizontalPodAutoscaler
metadata:
  name: hpa-test
  namespace: dev
  annotations: metric-config.external.prometheus-query.prometheus/autoregister_queue_latency: autoregister_queue_latency{endpoint="https",instance="192.168.99.101:8443",job="apiserver",namespace="default",quantile="0.99",service="kubernetes"}
spec:
  scaleTargetRef:
    apiVersion: extensions/v1beta1
    kind: Deployment
    name: test
  minReplicas: 1
  maxReplicas: 10
  Metrics:
  - type: External
    external:
      metric:
        name: prometheus-query
        selector:
          matchLabels:
            query-name: autoregister_queue_latency
      target:
        type: AverageValue
        averageValue: 1
To set up the kube-metrics-adapter:
git clone \
  https://github.com/zalando-incubator/kube-metrics-adapter.git

kubectl apply -f docs/rbac.yaml
kubectl apply -f docs/external-metrics-apiservice.yaml
kubectl apply -f docs/service.yaml
In docs/deployment.yaml, modify the name record for Prometheus’ service to match your own setup, and append the port number. For example:
--prometheus-server=http://prometheus.monitoring.svc.cluster.local:9090
And then apply the deployment:
kubectl apply -f docs/deployment.yaml
You should now have an external API set up - but there are no metrics being fed to it. You can see this by checking the API resources for external.metrics.k8s.io:
kubectl get --raw "/apis/external.metrics.k8s.io/v1beta1" | jq .
Which outputs:
{
  "kind": "APIResourceList",
  "apiVersion": "v1",
  "groupVersion": "external.metrics.k8s.io/v1beta1",
  "resources": []
}
Let’s set up an HPA and create a Prometheus collector
Prometheus
Of course, in order to get metrics from Prometheus, this requires that Prometheus is already aggregating the metrics that we desire.
In terms of metrics, we can import metrics from kube-state-metrics (kube object state metrics), node-exporter (host metrics), or we can import metrics from any service that exposes a metrics endpoint by defining targets for Prometheus to scape. This is done using service monitors. Like APIServices, service monitors require that these pods (if in the cluster) or binaries (if not) have a service that is able to point to the target we want Prometheus to scrape. For example, Prometheus can scrape a deployed instance of node-exporter using this service monitor:
kind: ServiceMonitor
metadata:
 name: node-exporter
 namespace: monitoring
spec:
 endpoints:
 - interval: 30s
   port: metrics
 jobLabel: jobLabel
 selector:
   matchLabels:
     app: prometheus-node-exporter
Horizontal Pod Autpscaler Final Steps
Deploy the application you want to scale:
apiVersion: v1
kind: Service
metadata:
 name: test
 namespace: dev
spec:
 ports:
 - name: http
   port: 80
   protocol: TCP
   targetPort: http
 selector:
   app: test
   release: dev
 sessionAffinity: None
 type: ClusterIP

---
apiVersion: extensions/v1beta1
kind: Deployment
metadata:
 name: test
 namespace: dev
spec:
 replicas: 1
 selector:
   matchLabels:
     app: test
     release: dev
 template:
   metadata:
     labels:
       app: test
       release: dev
   spec:
     containers:
       image: busybox
     command:
       - sleep
       - "3600"
       imagePullPolicy: IfNotPresent
       name: test
       ports:
       - containerPort: 80
         name: http
         protocol: TCP
EOF
When an HPA that defines a Prometheus collector is deployed, you can check it is working if there is a APIResource for external.metrics.k8s.io called prometheus-query. If there is, metrics are available from this endpoint:
kubectl get --raw "/apis/external.metrics.k8s.io/v1beta1" | jq .
Which outputs:
{
  "kind": "APIResourceList",
  "apiVersion": "v1",
  "groupVersion": "external.metrics.k8s.io/v1beta1",
  "resources": [
    {
      "name": "prometheus-query",
      "singularName": "",
      "namespaced": true,
      "kind": "ExternalMetricValueList",
      "verbs": [
        "get"
      ]
    }
  ]
}
You will also see these metrics being collected in the kube-metrics-adapter logs, for example:
kubectl logs -n kube-system \
  kube-metrics-adapter-6559fc9987-s8lhb
Example output
[...]
time="2019-05-24T16:14:07Z" level=info msg="Looking for HPAs" provider=hpa
time="2019-05-24T16:14:07Z" level=info msg="Found 0 new/updated HPA(s)" provider=hpa
time="2019-05-24T16:14:36Z" level=info msg="Collected 1 new metric(s)" provider=hpa
time="2019-05-24T16:14:36Z" level=info msg="Collected new external metric 'prometheus-query' (927) [query-name=autoregister_queue_latency]" provider=hpa
[...]
And that’s all you need to do to use your existing Prometheus metrics to autoscale pods in Kubernetes!
DevOps Engineer Final Thoughts
While this is a good foundation for ensuring that your applications are able to scale appropriately, there is more we can do to ensure that, not only is Kubernetes able to accommodate the additional capacity required by scalable applications (cluster autoscaling), but that Kubernetes is in a better place to be able to predict just how much capacity individual pods require (vertical pod autoscaling).
Check back soon when we’ll be looking at Vertical Pod Autoscaling in Kubernetes !